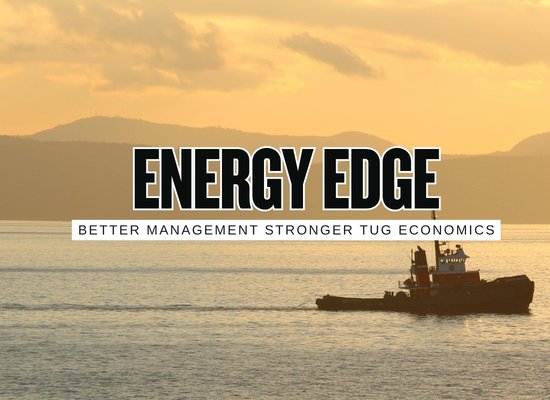
The tugboat market looks set for a practical growth cycle through 2033, but not a smooth one. The strongest demand signals are coming from three overlapping forces: ports need more reliable harbor-assist capacity as ships stay large and berth windows get tighter, offshore wind and offshore energy projects need more support vessels and marine logistics, and older fleets are facing renewal pressure from emissions rules, customer expectations, maintenance cost, and crewing efficiency. Market estimates vary widely because analysts define the tugboat market differently, but several current forecasts point to steady growth into the early 2030s. One forecast values the tugboat market at about $2.3 billion in 2026 and projects $3.1 billion by 2033, while another places the 2026 global market at $1.37 billion and projects $2.47 billion by 2033. The key takeaway for owners is not the exact market-size number. It is the direction of travel: ports, energy terminals, wind logistics, and clean-fleet mandates are creating a stronger case for newbuilds, repowers, hybrid systems, higher bollard pull, smarter dispatch, and longer-term service contracts.
Tug demand is shifting from simple replacement to strategic capacity
The tugboat market through 2033 is being shaped by port reliability, larger vessel calls, offshore wind logistics, LNG and energy-terminal growth, clean-port investment, and aging fleet replacement. The winning fleets will not simply be newer. They will be better matched to the job: stronger where ports need muscle, cleaner where customers need emissions progress, and smarter where scheduling and data matter.
One current tugboat market forecast projects global value reaching about $3.1 billion by 2033, from about $2.3 billion in 2026.
Another current market forecast puts the tugboat market on a faster path, projecting an 8.8% compound annual growth rate through 2033.
GWEC says more than 300 GW of offshore wind projects are in the pipeline for the next decade, creating long-run demand for marine support and port logistics.
EPA’s Clean Ports Program is funding zero-emission port equipment, infrastructure, and climate and air-quality planning, including eligible harbor craft and vessel-related equipment.
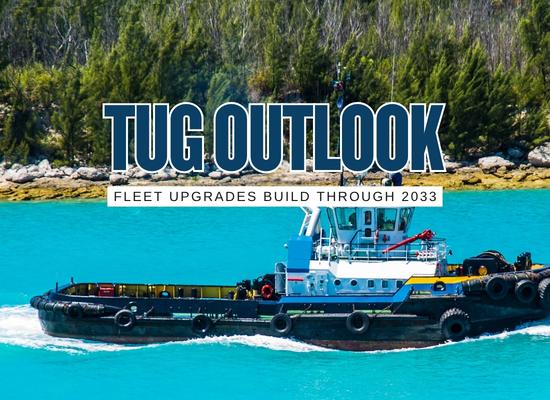
The outlook in one sentence
Through 2033, tug demand should be less about simply replacing old boats and more about buying the right operating capability for ports, offshore projects, emissions rules, tighter schedules, and higher customer expectations.
Sources: Persistence Market Research, Coherent Market Insights, GWEC offshore wind outlook, EPA Clean Ports Program, CARB commercial harbor craft, Riviera tug and salvage trends.
Market estimates vary, but the demand direction is clear
Tugboat forecasts are messy because the market can be counted several different ways. Some reports emphasize new vessel construction. Others include tugboat services, harbor assist, offshore support, escort work, river towage, regional vessel classes, or equipment segments. That is why one published forecast can show a much different market value from another while still pointing in the same direction.
The useful reading for owners and builders is the demand pattern. Ports are modernizing. Offshore wind has a large project pipeline. LNG and industrial terminals need higher reliability. Aging tugs are becoming more expensive to maintain. Emissions pressure is pushing repowers and alternative propulsion. Those forces support a real tug fleet investment cycle, even if exact global revenue estimates differ.
| Demand signal | Effect on tug demand | Likely winners | Watch item |
|---|---|---|---|
| Port growth | More ship calls, larger vessels, tighter berth windows, and higher reliability expectations. | High-availability harbor-assist fleets with strong dispatch and redundancy. | Overbuying bollard pull without fixing crew, maintenance, or response-time gaps. |
| Offshore wind | More marine logistics, feedering, port staging, towing, construction support, and long-term O&M support. | Operators with compliant vessels, project logistics experience, and flexible support capacity. | Policy delay, permitting risk, project cancellations, and vessel mismatch. |
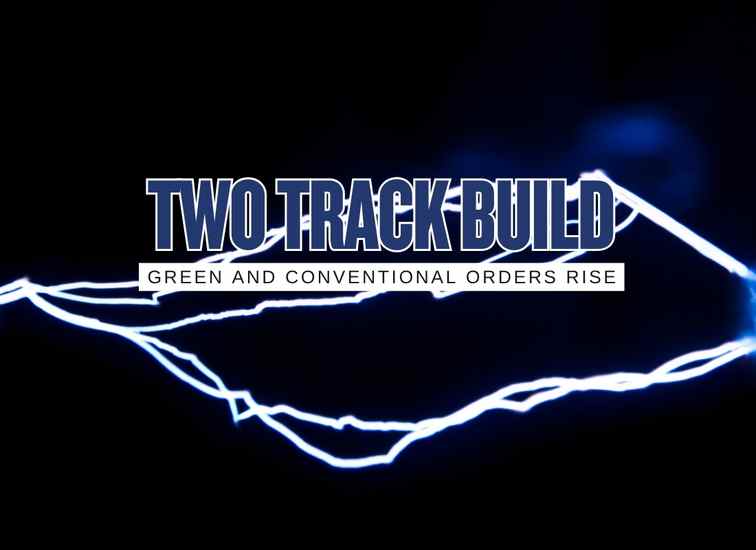
| Fleet renewal | Aging units face higher maintenance costs, emissions scrutiny, and reliability pressure. | Owners that time repowers and newbuilds before customer pressure peaks. | Shipyard slot availability, financing cost, and uncertain propulsion choices. |
| Clean ports | Electric, hybrid, methanol, battery-assist, and cleaner diesel options become more relevant in tenders. | Fleets that can prove emissions progress without sacrificing uptime. | Charging infrastructure, fuel availability, regulatory timing, and crew training. |
| Energy terminals | LNG, refinery, petrochemical, and export terminals need dependable escort and standby capacity. | Operators able to offer long-term service contracts and terminal-specific tug packages. | Concentration risk if a fleet is built around one customer or one project. |
Demand cycle through 2033
7 forces shaping tugboat demand through 2033
① Ports are buying reliability, not just tug hours
Port customers want vessel movements completed safely, on time, and with less disruption. Larger ships, tighter berth plans, limited pilot windows, weather events, and terminal congestion can turn a tug delay into a much larger port problem.
This pushes demand toward fleets with better redundancy, stronger dispatch systems, modern maintenance programs, and enough capable tugs to absorb schedule spikes. A port may not need only more tugs. It may need tugs that are available at the right moment with the right power and crew.
② Bigger ships continue to lift bollard pull expectations
Ports handling larger container ships, tankers, LNG carriers, cruise vessels, car carriers, and bulkers need more control during approach, turning, escort, berthing, and departure. Bollard pull is not the only metric, but it remains a highly visible procurement number.
Through 2033, buyers are likely to favor tugs that combine power with maneuverability, fendering, winch performance, stability, crew visibility, and proven harbor-assist behavior. The strongest market may be for capable mid-to-high bollard pull vessels that can work across several job types.
③ Offshore wind adds project-based demand, but with volatility
Offshore wind creates demand for port staging, feeder barges, towing, anchor handling, cable support, construction support, crew and equipment logistics, and long-term maintenance ecosystems. GWEC’s current offshore wind outlook points to a very large project pipeline for the next decade.
The opportunity is real, but not automatic. Offshore wind projects can be delayed by permits, grid issues, financing, policy changes, supply-chain cost, and local opposition. Tug operators should treat offshore wind as a powerful demand lane, but not as a guaranteed straight line.
④ Clean-port funding is pulling harbor craft into the upgrade conversation
Port decarbonization is no longer only a long-term talking point. Public funding, climate planning, clean-air programs, and customer reporting are moving cleaner port equipment into actual budgets. Harbor craft and tug operations can become part of that discussion because they are visible, local, and operationally important.
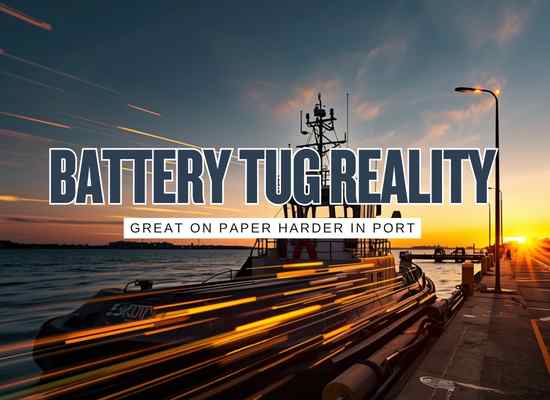
This does not mean every tug becomes battery-electric quickly. It does mean more buyers will ask about Tier 4 engines, hybrid systems, methanol readiness, battery assist, shore charging, idle reduction, emissions monitoring, and grant compatibility.
⑤ Fleet age creates a renewal floor
Many tug fleets can keep older vessels working for a long time, but age eventually shows up in maintenance cost, downtime, fuel burn, crew comfort, emissions profile, parts availability, and insurance or customer confidence.
Through 2033, fleet renewal may be driven by a combination of old-fashioned reliability and new market pressure. A vessel does not need to be banned to become commercially weaker. It only needs to become harder to crew, more expensive to maintain, less efficient, or less attractive in tenders.
⑥ Energy terminals support long-contract tug demand
LNG terminals, refinery docks, petrochemical facilities, offshore support bases, and export terminals often need reliable escort and standby service. These are not casual tug jobs. They can require dedicated crews, emergency readiness, specialized procedures, training, and long-term availability.
This supports modern tug investment because the service can be tied to a long-term contract rather than purely spot-market work. For builders, terminal-driven demand can support specialized escort tugs, hybrid packages, and safety-focused designs.
⑦ Data and autonomy-adjacent systems will influence fleet selection
Tugboats are not going fully autonomous across mainstream harbor operations overnight, but data systems are becoming more important. Owners and ports are paying more attention to fuel monitoring, engine diagnostics, dispatch optimization, emissions reporting, remote support, maintenance alerts, voyage data, and safety analytics.
By 2033, a tug that cannot provide useful performance data may look dated even if it still has adequate power. Market intelligence, customer reporting, and maintenance planning are all moving toward better data capture.
Regional demand lanes to watch
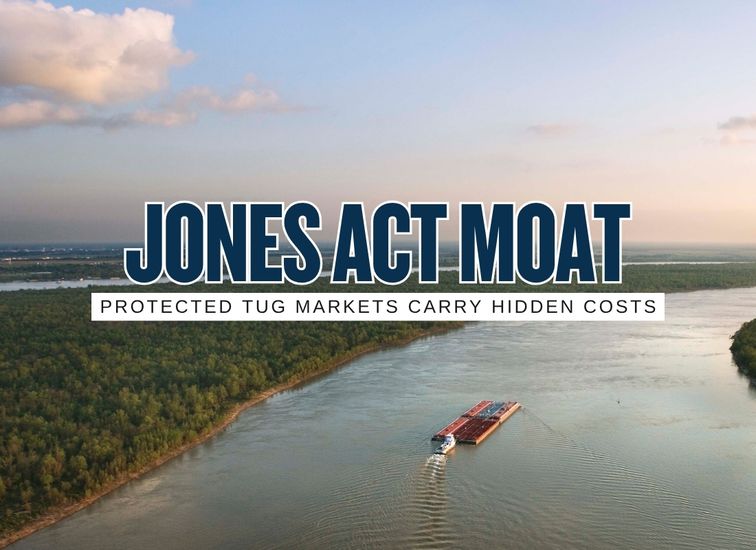
North America
Jones Act LNG Clean ports Fleet renewalDemand should be shaped by compliant domestic fleets, LNG terminal support, port decarbonization funding, California-style emissions pressure, aging assets, and offshore wind logistics where projects move forward.
Europe
Offshore wind Methanol Electric tugs Shore powerEurope is likely to stay important for alternative propulsion, offshore wind support, emissions-led procurement, and high-spec harbor tugs serving dense ports and passenger-facing waterfronts.
Asia Pacific
Port expansion Shipbuilding Green tug programs Trade growthAsia Pacific should remain a major demand center due to port growth, regional shipbuilding strength, offshore energy activity, green tug programs, and large-volume trade corridors.
Middle East and Africa
Energy terminals Port modernization Escort duty New capacityDemand should be tied to energy exports, port modernization, tanker and LNG support, regional logistics hubs, and the need for capable escort and harbor-assist fleets.
Latin America
Bulk exports Offshore energy Port reliability RepowersGrowth potential depends on commodity exports, offshore oil and gas activity, port upgrades, river systems, and the ability to finance fleet modernization in uneven markets.
Tug demand pressure calculator
This quick planning tool estimates whether a port, terminal, or tug operator is facing low, rising, medium, or high pressure to invest in tug capacity through 2033. It is designed for strategic planning, not vessel engineering.