The third crew does not automatically add 50% to payroll
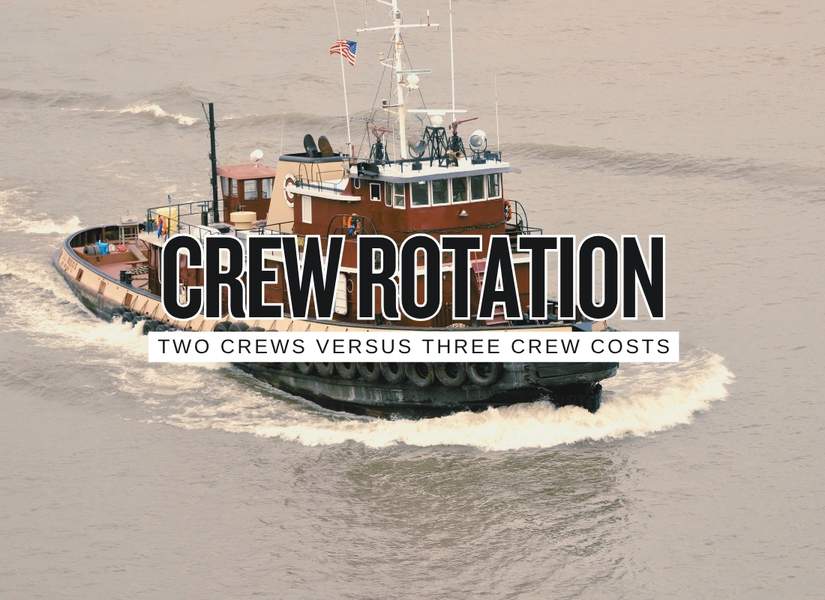
Most tug operators see three crews instead of two and immediately picture a 50% labor increase. On a day-rate boat, that can be completely wrong. The tug still needs only 365 days of onboard coverage. The expensive part starts when the third crew needs the same annual earnings, benefits and job security as the first two.
Approximate vessel days per mariner on a two-crew 14-on / 14-off rotation.
Approximate vessel days per mariner when three crews rotate 14-on / 28-off.
Increase in unique mariner headcount when going from two complete crews to three.
Increase in basic onboard day-rate wages if rates stay unchanged and the same 365 vessel days are simply divided three ways.
This report compares complete relief crews assigned to the vessel. It does not compare a two-watch versus three-watch bridge schedule while the crew is aboard. Those are separate manning decisions.
The rotation in one picture
Each crew covers about half the year. Two complete sets of mariners are needed.
Each crew covers about one-third of the year. Headcount rises, but total vessel coverage does not.
The annual cost math
| Cost driver | Two crews | Three crews | Annual effect | Operator read |
|---|---|---|---|---|
| Headcount | 2 complete crew sets | 3 complete crew sets | +50% | More medicals, training files, benefits, HR administration and relief personnel. |
| Vessel crew-days | 365 | 365 | No change | The tug itself does not suddenly require more operating days. |
| Paid days per mariner | ~182.5 | ~121.7 | -33% | This is the biggest recruiting issue in a pure day-rate system. |
| Base day-rate payroll | Day rate × 365 | Day rate × 365 | 0% at equal rates | Adding names to the roster does not add vessel-days. |
| Annual earnings protected | Baseline | Day rate needs roughly +50% | About +50% wage bill | This is where the three-crew model can become expensive fast. |
| Benefits | Fewer covered employees | 50% more employees | Usually higher | Health, retirement and fixed employee costs may not fall with fewer sea days. |
| Crew changes | About every 14 days | About every 14 days | Little change | Keeping the same hitch length means roughly the same vessel-level crew-change frequency. |
| Workover exposure | Higher | Potentially lower | Can offset cost | A third crew creates more room for training, sickness, leave and vacancies. |
| Retention | Half the year aboard | About one-third aboard | Potential benefit | More home time can become a recruiting tool if annual earnings remain competitive. |
The cost pivot
Base wage expense can stay almost unchanged because 365 vessel-days are simply divided among more people. Fixed employee overhead becomes the main premium.
A mariner going from roughly 183 paid days to 122 needs about 1.5 times the day rate to preserve annual gross earnings.
If every mariner receives a full annual salary regardless of days aboard, increasing the number of complete crews from two to three can approach a 50% payroll increase before other savings.
The third crew earns its keep through four pressure points
A thin two-crew roster gets expensive when illness, training or vacancies repeatedly force people to stay aboard.
More home time has value when licensed masters, mates and engineers are difficult to replace.
The third crew creates room for simulator work, recurrent training, medicals and upgrades without immediately creating a relief problem.
A deeper pool can absorb a resignation, injury or credential problem without leaving the tug waiting for a qualified replacement.
More days at home improve recovery between hitches, but a three-crew relief rotation does not automatically fix a poor watch schedule aboard the vessel. NTSB towing casualties continue to show that limited sleep, night watches and accumulated sleep debt can degrade performance. The onboard watch arrangement still needs its own fatigue review.
Current labor context
| Current benchmark | Latest published figure | Use in a tug model |
|---|---|---|
| Captains, mates and pilots | $92,460 median annual wage | Useful market benchmark, but tug rates vary substantially by route, license and rotation. |
| Ship engineers | $109,530 median annual wage | Engineering labor can be one of the hardest positions to dilute across three low-day rotations. |
| Sailors and marine oilers | $51,520 median annual wage | Useful reference for deck labor, not a harbor-tug tariff. |
| Transportation benefits | $16.90/hr benefits vs $32.95/hr wages | Shows why headcount cost extends well beyond the quoted day rate. |
| Towing work limit | 12 hours in a consecutive 24 for covered masters/mates | Rotation design cannot be separated from watchkeeping compliance. |
Two crew vs three crew annual cost calculator
This model separates vessel-day wages from the hidden cost of adding more individual employees.
The vessel still buys 365 crew-days. The largest cost jump appears when annual mariner earnings are protected despite each person working fewer days.